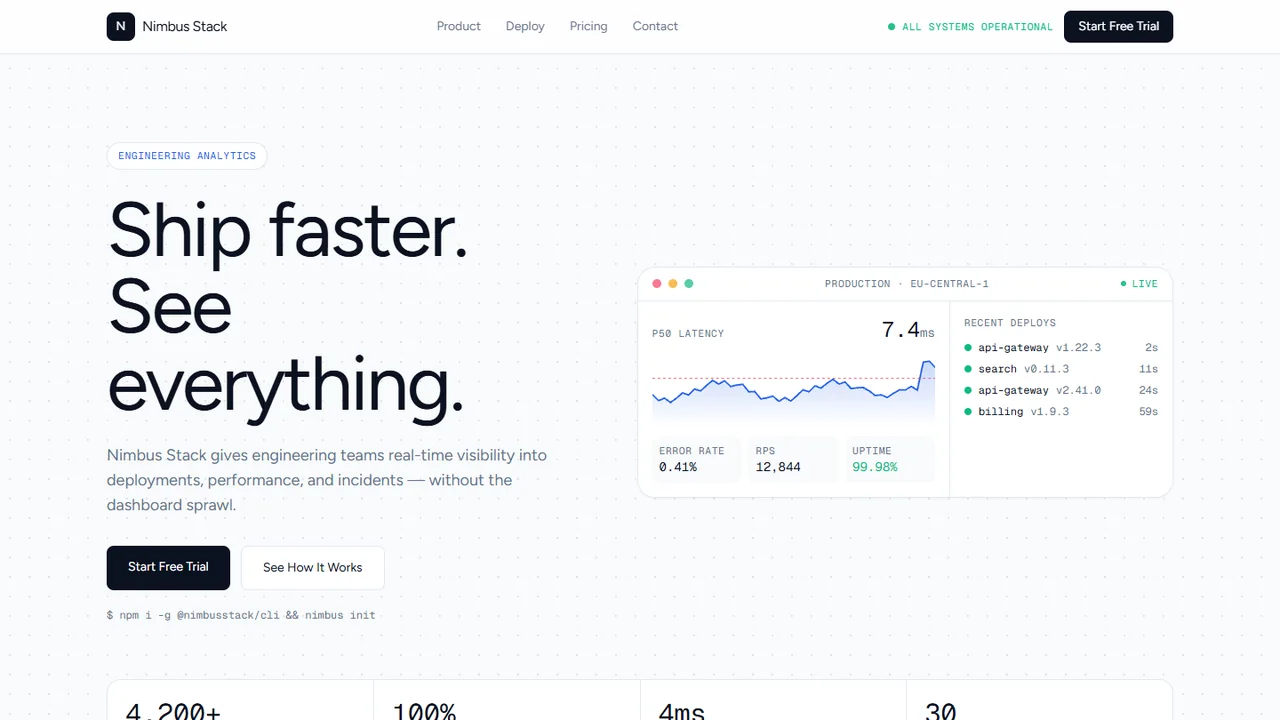
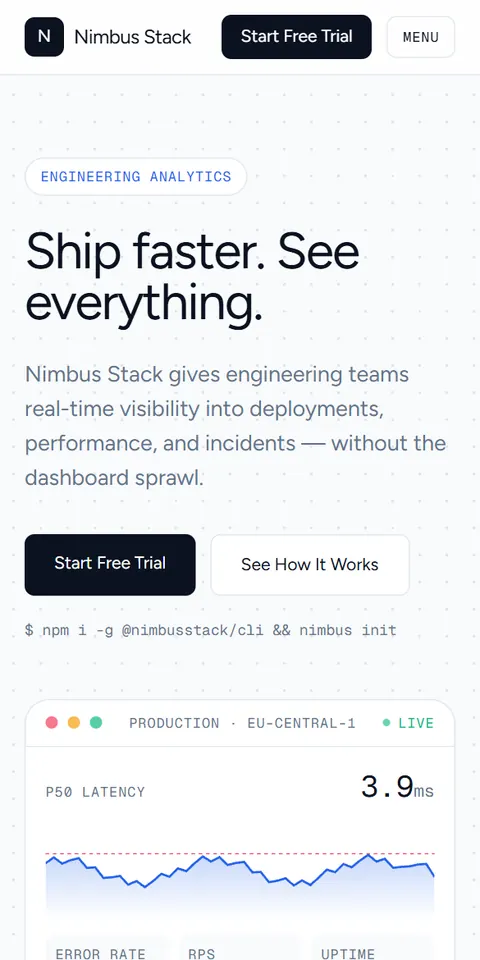
A product metrics panel
Latency, error rate, throughput and uptime shown as dashboard panels, with recent deploy cards beside them, so the product is seen rather than described.
 TYCHALOG
SaaS buyers need to see the product working before they commit — so the website should show it, not describe it. Nimbus does that literally: a live metrics dashboard that ticks, a deploy pipeline you can run in the browser, and a pricing slider that picks your plan, all in a light bento layout.
Every section below is already built and working in the live demo — not a mock-up.
Latency, error rate, throughput and uptime shown as dashboard panels, with recent deploy cards beside them, so the product is seen rather than described.
A pipeline view with stages — install, build, test, deploy — that visitors trigger right in the browser.
Move the slider to your event volume and team size, and the right tier lights up, with monthly and yearly toggle.
Enterprise compliance shown up front, and a form that asks about team size and what you're trying to see.
The dashboard shows placeholder data out of the box. Connecting it to your real metrics requires the Business plan, which includes API integrations and a client area for authenticated data.
The demo is a visual pipeline that runs in the browser; it's not connected to your infrastructure. Customizing it to mirror your actual deploy process is a support request included in your plan.
The Premium Ultra design is a one-time licence added to your chosen plan. The price is shown on the page and in the cart, and it gives you this specific template's design and interactions.
Pick the design, choose a plan, and we adapt it to your business, your content and your language before it goes live.