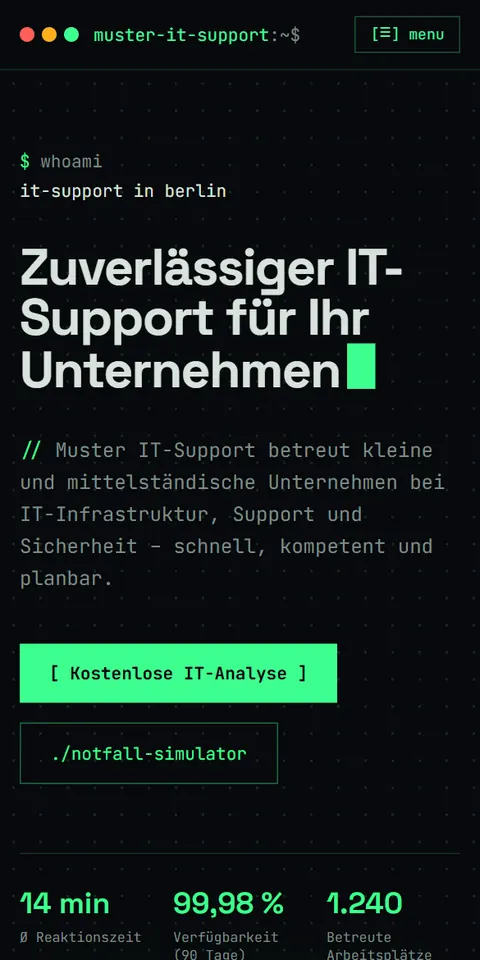
A status dashboard
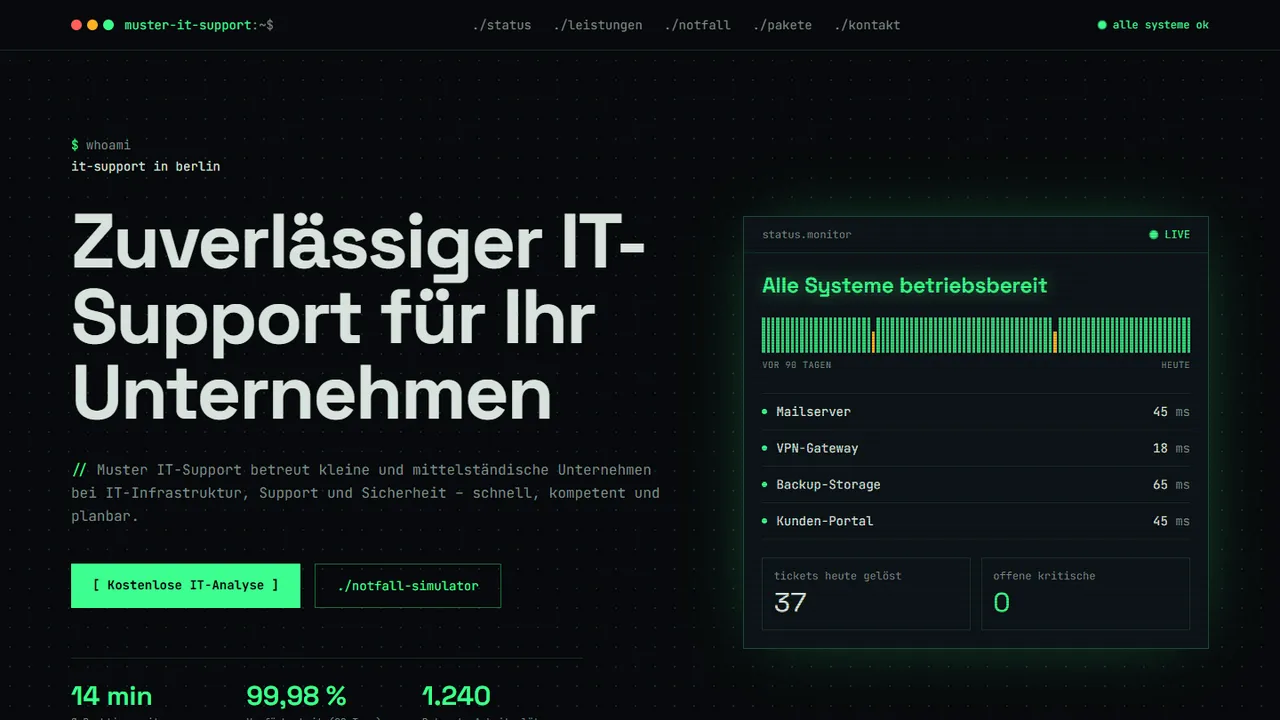
Availability over the last 90 days as a bar chart, average response time and the number of workstations under management, so monitoring is shown rather than claimed.
 TYCHALOG
Companies hire IT support to keep their systems running, not to chase tickets — so the website should show that everything is under control. Statusseite does that with a black-and-green terminal, a live status dashboard, and an incident simulator that types out the fix, alongside managed services, network support, IT security and cloud solutions.
Every section below is already built and working in the live demo — not a mock-up.
Availability over the last 90 days as a bar chart, average response time and the number of workstations under management, so monitoring is shown rather than claimed.
Lets visitors choose a scenario and watch the fix being typed out live, demonstrating the team's response process without a sales call.
Managed IT support, network support, IT security and cloud solutions, each with a terminal-style command description.
Three service packages read as .yml files — price per workstation, response time, service hours and what is included — each ending in a deploy button.
The demo shows sample data. After launch, the dashboard can be connected to your monitoring system via an API integration, available with the Business plan.
Yes, the contact form is designed for support inquiries. A full ticketing system integration is available with the Business plan.
The terminal look is a visual theme, but the navigation and content are clear for any business owner. Colours and type can also be adjusted to match your brand.
Pick the design, choose a plan, and we adapt it to your business, your content and your language before it goes live.